

Better Data Visualizations
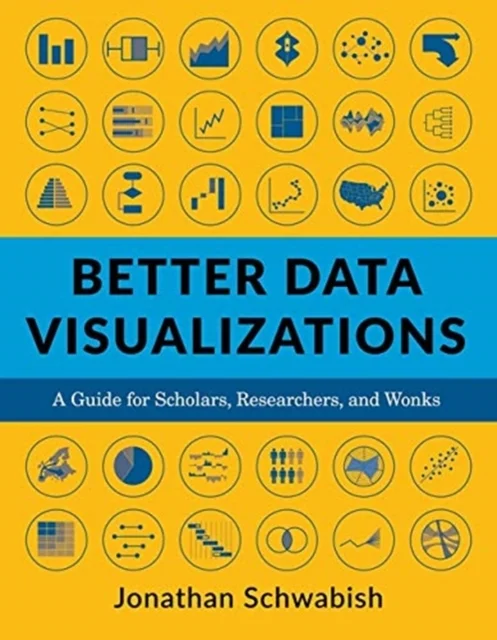
A Guide for Scholars, Researchers, and Wonks
Jonathan Schwabish · Columbia University Press · 2021
Now more than ever, content must be visual if it is to travel far. Readers everywhere are overwhelmed with a flow of data, news, and text. Visuals can cut through the noise and make it easier for readers to recognize and recall information. Yet many researchers were never taught how to present their work visually. This book details essential strategies to create more effective data visualizations. Jonathan Schwabish walks readers through the steps of creating better graphs and how to move beyond simple line, bar, and pie charts. Through more than five hundred examples, he demonstrates the do’s and don’ts of data visualization, the principles of visual perception, and how to make subjective style decisions around a chart’s design. Schwabish surveys more than eighty visualization types, from histograms to horizon charts, ridgeline plots to choropleth maps, and explains how each has its place in the visual toolkit. It might seem intimidating, but everyone can learn how to create compelling, effective data visualizations. This book will guide you as you define your audience and goals, choose the graph that best fits for your data, and clearly communicate your message.
Uus kasutamata raamat
Detailid
- Alapealkiri
- A Guide for Scholars, Researchers, and Wonks
- Autor
- Jonathan Schwabish
- ISBN
- 9780231193115
- Aasta
- 2021
- Kirjastus
- Columbia University Press
- Keel
- inglise
- Köide
- Pehme kaas
- Lehekülgi
- 464
- Teema
- Teatmeteosed ja üldteadmised › Entsüklopeediad ja teatmeteosed — Encyclopaedias & reference works
- Kaal
- 1.14 kg