

Everyday Data Visualization
Desiree Desiree · Manning Publications · 2024
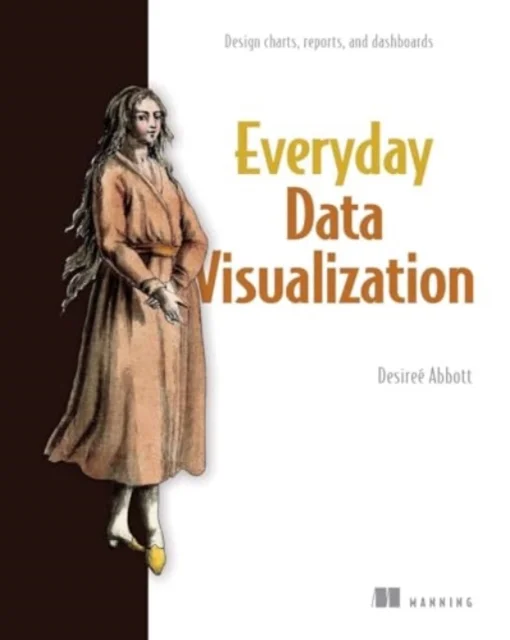
Desiree Desiree · Manning Publications · 2024
Radically improve the quality of your data visualizations by employing core principles of color, typography, chart types, data storytelling, and more.
Everyday Data Visualization is a field guide for design techniques that will improve the charts, reports, and data dashboards you build every day. Everything you learn is tool-agnostic, with universal principles you can apply to any data stack.
In Everyday Data Visualization you’ll learn important design principles for the most common data visualizations:
Harness the power of perception to guide a user’s attention
Bring data to life with color and typography
Choose the best chart types for your data story
Design for interactive visualizations
Keep the user’s needs first throughout your projects
This book gives you the tools you need to bring your data to life with clarity, precision, and flair. You’ll learn how human brains perceive and process information, wield modern accessibility standards, get the basics of color theory and typography, and more.
About the technology
Even mundane presentations like charts, dashboards, and infographics can become engaging and inspiring data stories! This book shows you how to upgrade the visualizations you create every day by improving the layout, typography, color, and accessibility. You’ll discover timeless principles of design that help you highlight important features, compensate for missing information, and interact with live data flows.
About the book
Everyday Data Visualization guides you through basic graphic design for the most common types of data visualization. You’ll learn how to enhance charts with color, encourage users to interact and explore data and create visualizations accessible to everyone. Along the way, you’ll practice each new skill as you take a dashboard project from research to publication.
What's inside
Bring data to life with color and typography
Choose the best chart types for your data story
Design interactive visualizations
About the reader
For readers experienced with data analysis tools.
About the author
Desireé Abbott has over a decade of experience in product analytics, business intelligence, science, design, and software engineering.
The technical editor on this book was Michael Petrey.
Table of Contents
PART 1
1 Hello, data viz!
2 How we perceive information
3 It’s all about the data
PART 2
4 Choosing colors
5 Typography
6 Creating a good chart
7 Designing for interactivity
PART 3
8 Research, design, and development
9 Troubleshooting
Appendix
Uus kasutamata raamat
Detailid
- Autor
- Desiree Desiree
- ISBN
- 9781633438408
- Aasta
- 2024
- Kirjastus
- Manning Publications
- Keel
- inglise
- Köide
- Kõva kaas
- Lehekülgi
- 264
- Teema
- Arvutid ja infotehnoloogia — Computing & information technology
- Kaal
- 556 g